
Otto Neumann · 1 November 2026
Community Sessions Expose Equity Gaps in Poland's Expanding Regional Transportation Infrastructure
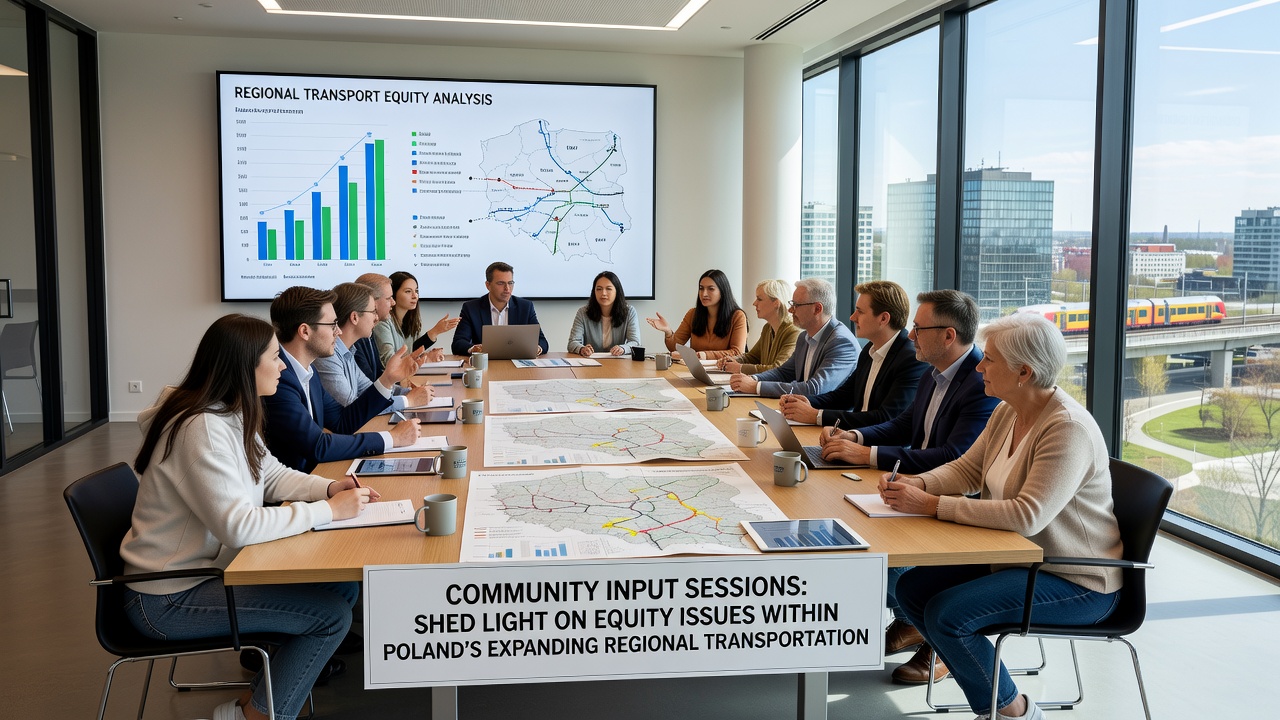
Public consultations held across several Polish regions in November 2026 brought forward detailed accounts of uneven access to expanding transportation networks, and data from those meetings showed persistent gaps in service for rural communities alongside low-income urban districts. Officials from regional authorities compiled notes from dozens of gatherings where participants described long wait times for connections, limited stops in peripheral areas, and barriers for people with mobility needs, while network expansions continued to prioritize major corridors between cities such as Krakow, Lodz, and Gdansk.
Records from the sessions indicate that planners received over 1,200 individual submissions during the autumn period, and those documents outlined specific routes where daily commuters faced extended travel times because new lines bypassed smaller settlements. Figures released by regional transport boards reveal that areas with higher proportions of elderly residents and households without private vehicles experienced the most pronounced shortfalls in frequency and coverage, even as overall investment in rail and bus infrastructure rose by 18 percent between 2023 and 2026.
Background on Network Expansions
Poland's regional transportation systems have undergone steady upgrades financed through national and European funds, and these projects include new rail links, bus rapid transit corridors, and integrated ticketing platforms designed to connect industrial zones with residential clusters. Data compiled by the Ministry of Infrastructure shows that more than 850 kilometers of upgraded track entered service during the past three years, yet distribution of those improvements remains concentrated along high-traffic axes serving larger population centers.
Observers note that funding allocations often favor projects promising the highest passenger volumes, and this approach leaves secondary routes with fewer resources for frequency increases or accessibility upgrades. Maps presented during the November 2026 sessions illustrated how several new stations opened in suburban zones while older lines serving agricultural communities continued to operate with reduced schedules, and participants supplied personal travel logs documenting average commute extensions of 25 minutes for those living beyond the main corridors.
Key Themes from the Input Sessions
Transcripts from the meetings highlight recurring concerns about fare structures that do not account for varying income levels across regions, and multiple groups pointed to the absence of reduced-rate options for shift workers who rely on late-night services. Representatives from disability advocacy organizations presented evidence that platform heights and vehicle designs on certain regional lines still require manual assistance, despite national standards adopted in 2022.
One case presented involved a cluster of villages near Poznan where residents reported that the nearest reliable bus stop sat more than four kilometers from housing estates, and data from local surveys indicated that schoolchildren and medical patients absorbed the largest share of those distances. Planners responded by noting that route optimization models prioritize total ridership numbers, yet session attendees countered with alternative calculations that factored in social service trips and access to employment centers located outside primary hubs.
Data Patterns and Regional Variations
Analysis shared at the sessions drew on travel surveys conducted between 2024 and 2026, and those datasets indicated that households in the lowest income quartile spent 12 percent more of their monthly budget on transportation compared with higher-earning groups in the same districts. Researchers from several Polish universities cross-referenced ticket sales with census information to demonstrate that coverage gaps widened most sharply in counties where population density fell below 150 persons per square kilometer.
According to the European Commission transport portal, similar patterns appear in other member states where rapid network growth outpaces equity assessments, and Polish officials referenced those comparative figures when outlining plans for revised evaluation criteria. Another set of statistics from an OECD transport review showed that targeted adjustments to service frequency in comparable mid-sized economies produced measurable gains in employment access within two years of implementation.
Responses from Planning Bodies
Regional authorities stated that they would incorporate session feedback into the next round of network modeling, and they scheduled follow-up meetings for early 2027 to review proposed route adjustments. Technical teams began examining options for on-demand micro-transit pilots in low-density zones, while finance departments explored blended funding models that combine national grants with local contributions to support extended operating hours.
Minutes from the November gatherings also record commitments to audit accessibility compliance on all lines added since 2024, and contractors received updated specifications requiring level boarding on replacement vehicles ordered through 2028. Participants received digital summaries of the collected data along with timelines for when revised service plans would return for public comment.
Conclusion
The community input process documented in late 2026 established a clearer record of where equity shortfalls intersect with ongoing expansion efforts, and the compiled materials now feed directly into technical reviews that shape future investment decisions. Regional transport agencies continue to process the submissions while preparing updated coverage maps that reflect the geographic distribution of both benefits and remaining gaps.